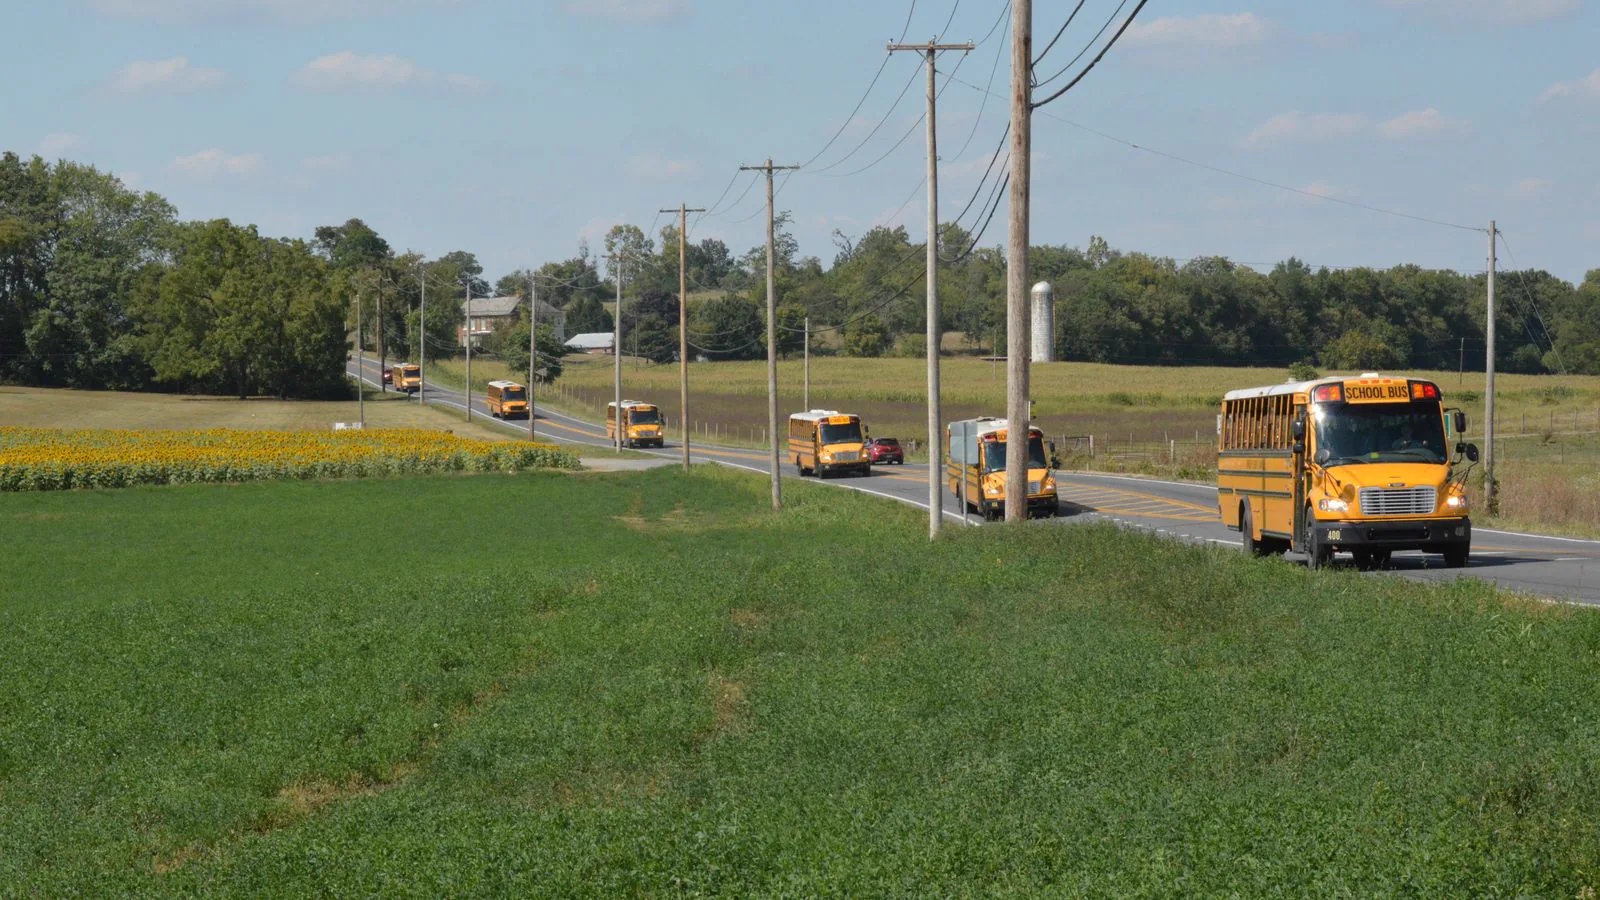
Rural schools are smaller at every conventional school level in our matched federal dataset. The median rural high school enrolls 269 students, compared with 991 at the median suburban high school. Reported student–teacher ratios differ too, but by much less than enrollment.
86,058
schools in matched groups
12 groups
level-by-locale comparisons
2024–25
measurement year
We grouped NCES locale codes into their four broad categories—city, suburb, town, and rural—then calculated the median school enrollment and student–teacher ratio within each school level. Restricting each comparison to elementary, middle, or high schools avoids confusing community type with basic differences in grade configuration.
The full level-by-locale comparison
| School level | Locale | Schools | Median enrollment | Median student–teacher ratio |
|---|---|---|---|---|
| Elementary | City | 15,103 | 437 | 15.1:1 |
| Elementary | Suburb | 16,836 | 474 | 14.8:1 |
| Elementary | Town | 4,913 | 400 | 14.7:1 |
| Elementary | Rural | 13,270 | 300 | 13.7:1 |
| Middle | City | 3,674 | 615 | 15.3:1 |
| Middle | Suburb | 5,137 | 691 | 15.0:1 |
| Middle | Town | 2,058 | 466 | 14.5:1 |
| Middle | Rural | 4,545 | 287 | 13.8:1 |
| High | City | 5,237 | 538 | 15.7:1 |
| High | Suburb | 5,185 | 991 | 15.9:1 |
| High | Town | 2,578 | 525 | 15.2:1 |
| High | Rural | 7,522 | 269 | 12.6:1 |
The enrollment contrast is strongest at high schools. Median suburban high-school enrollment is 991, nearly four times the rural median of 269. City and town high schools sit much closer together at 538 and 525 students, respectively.
At elementary schools, the spread is narrower: the locale medians run from 300 students in rural areas to 474 in suburbs. Middle schools again show a pronounced suburban–rural difference.
Staffing ratios move less than enrollment
Median student–teacher ratios range from 12.6:1 at rural high schools to 15.9:1 at suburban high schools. Every rural median is lower than its city or suburban counterpart in this snapshot, but the measure is not class size and should not be read as direct evidence of smaller classes.
Teacher full-time equivalents can include staff working across different subjects and settings. Scheduling, course choice, intervention groups, special education, and part-time allocations all affect what a student experiences. Two schools with the same overall ratio can organize classrooms very differently.
Why community type shapes the numbers
Population density changes how far students travel and how easily a district can consolidate grade levels. Rural districts may operate small schools because communities are far apart. Suburban systems can draw from dense residential catchments, while city systems may divide enrollment among more nearby campuses or specialized options.
Those structures create tradeoffs rather than a simple hierarchy. A small rural high school may offer close relationships and a manageable environment but have fewer course sections. A large suburban high school may sustain a broader catalog while requiring more navigation and competition for some activities. City schools vary especially widely because a single locale category can include neighborhood schools, magnets, charters, selective programs, and alternative campuses.
How to use locale in a real comparison
- Compare the school with peers at the same level and in the same broad locale.
- Ask how enrollment affects course availability, transportation, activities, and support staffing.
- Look beyond the broad label to the NCES subcategory, such as large city, fringe rural, or remote rural.
- Check whether a school’s grade span or specialized mission makes it unlike the apparent peer group.
- Confirm current enrollment and staffing locally, especially when the school has changed recently.
Analysis notes
The analysis includes 86,058 current elementary, middle, and high-school records with a recognized 2024–25 NCES locale, positive enrollment, and a positive calculable student–teacher ratio. Other school configurations are excluded because they are not directly comparable with conventional levels. Each school receives equal weight.
Medians describe the middle reported school and reduce the influence of very large campuses. They do not show the full spread within a locale, control for state policy or labor markets, or establish that locale caused any difference.
Sources and methodology
- NCES EDGE geographic data — 2024–25 locale classifications.
- NCES Common Core of Data — 2024–25 enrollment and classroom-teacher FTE.
- US School Ratings calculation rules — ratio formula, medians, record joins, and limitations.